
Nifty & Bank Nifty Post Market Analysis for 11 July 2025 | Strategy for 14 July
Published by: IntradayAFL
Key Takeaways
- Nifty closed at 25,140.55, ending the session with strong bearish momentum.
- Bank Nifty settled at 56,712.85, after a TGT3 sell signal triggered significant downside.
- Both indices showed clear breakdowns after midday reversals.
- Profit booking and weak global cues contributed to the intraday sell-off.
Price Action Breakdown
Nifty 50 (5-Minute Chart)
Nifty opened on a flat note and remained range-bound in the first half. A decisive sell signal was triggered at ₹25,491.15, with multiple targets (TGT2) hit, confirming intraday weakness. The steep fall post-lunch session shows a breakdown of crucial support zones. The price closed near the day’s low, suggesting further downside unless reversed by strong global cues.
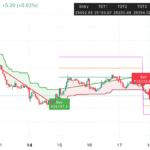
Bank Nifty (5-Minute Chart)
Bank Nifty gave a clearer breakdown. A strong sell at ₹57,131.55 delivered over 315 points profit with TGT3 hit. Post 12:00 PM, the index broke through multiple intraday supports and formed lower highs and lower lows. The close near the bottom indicates continued bearishness unless supported by positive macro developments.
Global Market and Macro Updates
- US CPI data released overnight showed higher inflation expectations, raising rate-hike concerns. [Source: Investing.com]
- Asian Markets closed mixed; Hang Seng was down while Nikkei held steady. [Source: Moneycontrol]
- Crude oil prices saw mild gains, supporting energy stocks slightly.
- FIIs continued to be net sellers for the third consecutive session. [Source: CNBC]
Technical Indicator Table
| Indicator | Nifty | Bank Nifty |
|---|---|---|
| RSI (14) | 33.2 (Bearish) | 31.8 (Bearish) |
| India VIX | 12.48 (+3.2%) | |
| Put Call Ratio (PCR) | 0.87 (Neutral-to-Bearish) | |
Sector Performance
| Sector | Performance |
|---|---|
| Banking | -0.85% |
| IT | -1.12% |
| FMCG | +0.45% |
| Pharma | +0.62% |
Trading Strategy for 14/07/25 (Intraday + Swing)
- Intraday: Look for early sell triggers if price fails to reclaim previous day’s high. Use trailing stop-loss once Entry and TGT1 levels hit.
- Swing: Trend remains bearish. Sell on rallies around resistance zones with SL just above last swing high.
- Use the Free Buy-Sell Chart for real-time setups.
- Access our TradingView Indicator Script to automate signals.
Key Levels to Watch
| Index | Support | Resistance | Trend |
|---|---|---|---|
| Nifty | 25,030 / 24,940 | 25,280 / 25,400 | Bearish |
| Bank Nifty | 56,620 / 56,450 | 56,950 / 57,180 | Bearish |
Final Thoughts
Markets are at a crucial juncture. Both indices broke key support levels and closed near the day’s lows. Global headwinds and institutional selling may weigh further. However, a relief rally can’t be ruled out. Risk management remains the key. Use reliable signal systems for confirmed entries.
Disclaimer
This analysis is for educational purposes only. Trading in financial markets involves risk. Always consult your financial advisor before taking positions.